
Keen readers of this blog (hi Mom!) might have noticed my recent focus on neural networks and deep learning. It’s good for popularity, as deep learning posts are automatically cool (I’m really big in China now). Well, I’m going to leave the AI alone this time. In fact, this post won’t even really constitute data science. Instead, I’m going to explore a topic that has been on my mind and maybe produce a few graphs.
These days, my main interaction with modern music is through the radio at the gym. It wasn’t always like this. I mean I used to be with it, but then they changed what it was. I wouldn’t go so far as to say that modern music is weird and scary, but it’s certainly getting harder to keep up. It doesn’t help that songs now have about 5 people on them. Back in my day, you might include a brief rapper cameo to appear more edgy. So I thought I’d explore how song collaborations have come to dominate the charts.
The complete R code can be found here. Let’s get started!
Getting the Data
In my research, I came across a similar post. That one looked at the top 10 of the Billboard charts going back to 1990. Just to be different, I’ll primarily focus on the UK singles chart, though I’ll also pull data from the Billboard chart. From what I can tell, there’s no public API. But it’s not too hard to scrape the data off the official site. We’ll pull the data off the site using Rvest. Luckily, we can easily loop through the weekly charts by altering the date in the page URL, until it finally reaches the first chart in November 1952.
library(rvest) # for scraping
library(dplyr) # data frame manipulation
library(plotly) # plotting
library(jsonlite) # importing json files

# function to scrape the UK Singles Chart
get_UK_Chart <- function(week){
  url = paste0("http://www.officialcharts.com/charts/singles-chart/",
               format(as.Date(week), format="%Y%m%d"),"/7501/")
  scraped_page <- read_html(url)
  artist_info <- scraped_page %>% html_nodes("#main .artist a")
  data.frame(
    chart_week = scraped_page %>% html_nodes(".article-heading+ .article-date") %>%
      html_text() %>% trimws() %>% gsub(" -.*","",.),
    chart_pos = scraped_page %>% html_nodes(".position") %>%
      html_text() %>% as.integer(),
    artist = artist_info %>% html_text(),
    artist_number = artist_info %>% html_attr("href") %>%
      gsub("/artist/","",.) %>% gsub("/.*", "", .) %>% as.integer(),
    track = scraped_page %>% html_nodes(".track .title a") %>%
      html_text(),
    label = scraped_page %>% html_nodes(".label-cat .label") %>%
      html_text(),
    last_week = scraped_page %>% html_nodes(".last-week") %>%
      html_text() %>% gsub("[^0-9]", "", .) %>% as.integer(),
    peak_pos = scraped_page %>% html_nodes("td:nth-child(4)") %>%
      html_text() %>% as.integer(),
    weeks_on_chart = scraped_page %>% html_nodes("td:nth-child(5)") %>%
      html_text())
  }
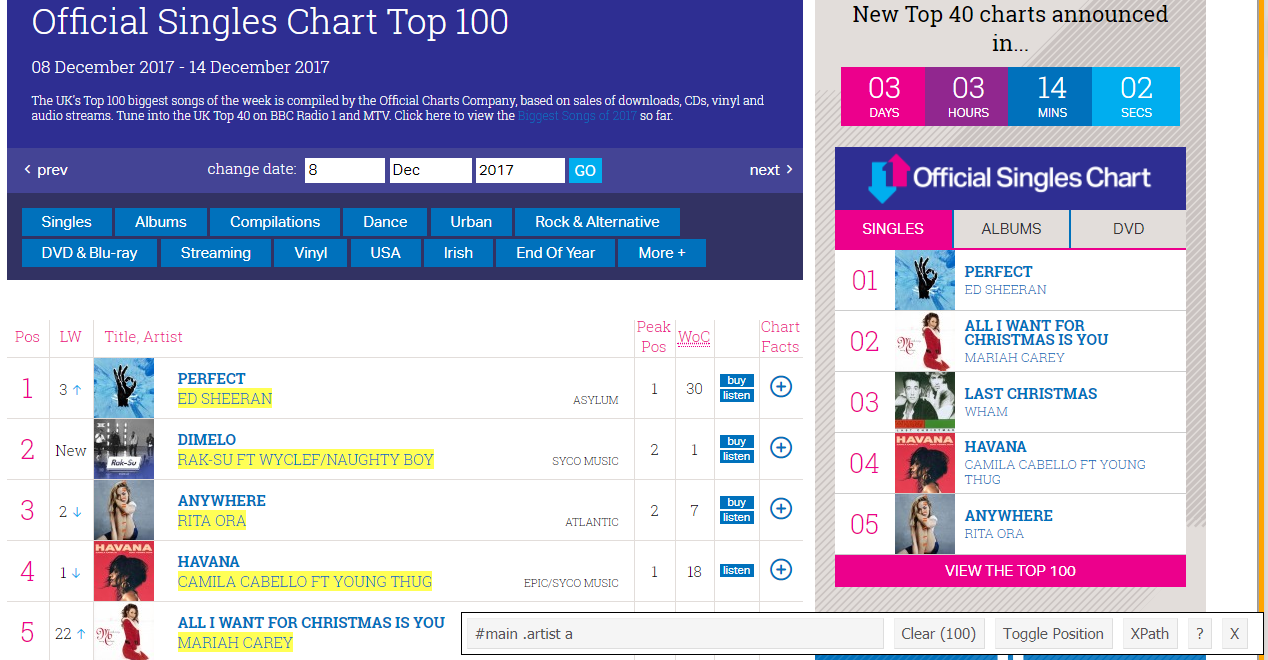
Briefly explaining what happens in the get_UK_chart function: We specify the chart week we want to scrape. That data is grabbed off the website. We then use particular CSS elements to extract the features we’re interested in (e.g. #main .artist a represents the artist name). The last part may seem complicated, but it’s actually quite easily achieved with a browser tool like Selector Gadget (see image below).
Now we need to loop through each week and execute get_UK_chart. At the end, the list of dataframes from each week will be combined in one dataframe called uk_chart. The code is slightly complicated by the inclusion of some basic error handling. In my experience, get_UK_chart will sometimes fail due to connection timeouts. The while loop and the try within it means that one of these errors won’t mess up the entire loop. Instead, it will execute get_UK_chart again, which should work correctly this time (assuming there isn’t a more serious underlying problem).
# litte bit of formatting to scrape each UK singles chart all the back to 1952
today_date <- Sys.Date()
first_uk_chart_date <- as.Date("1952-11-14")
date_diffs_uk <- as.numeric(today_date - first_uk_chart_date)
recent_chart_date_uk <- Sys.Date() - date_diffs_uk%%7


uk_chart <- lapply(seq(0,date_diffs_uk,7), function(x){
  print(recent_chart_date_uk - x)
  output <- NULL
  attempt <- 0
  # scrapes can fail occasionally (e.g. conenction timeout)
  # so we'll allow it to fail 5 times in a row
  while( is.null(output) && attempt <= 5 ) {
    attempt <- attempt + 1
    if(attempt>=2){
      print(paste("Scraping Attempt #",attempt))
      Sys.sleep(1)
    }
    try(
      output <- get_UK_Chart(recent_chart_date_uk - x)
    )
  }
  # not necessary but sometimes it's good to pause between scrapes
  Sys.sleep(0.5)
  return(output)
}) %>% dplyr::bind_rows()
Parsing the Data
If that all went to plan, you should have a dataframe called uk_chart in your global environment. If you don’t want to loop through each week, then you can import the file directly from github (you can also find the corresponding Billboard Hot 100 file there- you might prefer downloading the files and importing them locally). It’s a JSON file, as it was actually generated from Python version of this post.
# load in JSON file
uk_chart <- read_json("https://raw.githubusercontent.com/dashee87/blogScripts/master/files/uk_charts.json",
                      simplifyVector = TRUE) %>%
  mutate(chart_week=as.Date(chart_week, format="%d %B %Y"))
head(uk_chart, 5)
##   peak_pos chart_week weeks_on_chart                       artist
## 1        1 2017-12-08             30                   ED SHEERAN
## 2        2 2017-12-08              1 RAK-SU FT WYCLEF/NAUGHTY BOY
## 3        2 2017-12-08              7                     RITA ORA
## 4        1 2017-12-08             18 CAMILA CABELLO FT YOUNG THUG
## 5        2 2017-12-08             83                 MARIAH CAREY
##                             track           label artist_num chart_pos
## 1                         PERFECT          ASYLUM       6692         1
## 2                          DIMELO      SYCO MUSIC      52716         2
## 3                        ANYWHERE        ATLANTIC       7418         3
## 4                          HAVANA EPIC/SYCO MUSIC      51993         4
## 5 ALL I WANT FOR CHRISTMAS IS YOU        COLUMBIA      25943         5
##   last_week
## 1         3
## 2
## 3         2
## 4         1
## 5        22
That table shows the top 5 singles in the UK for week starting 8st December 2017. I think I recognise two of those songs. As we’re interested in collaborations, you’ll notice that we have a few in this top 5 alone, which are marked with an ‘FT’ in the artist name. Unfortunately, there’s no consistent nomenclature to denote collaborations on the UK singles chart (the Billboard chart isn’t as bad).
##   peak_pos chart_week weeks_on_chart                        artist
## 1        3 1993-02-14              6          WEST END FEAT. SYBIL
## 2      100 2000-09-24              1         MUTINY FEAT D-EMPRESS
## 3       48 1998-12-20              2        JODE FEATURING YO-HANS
## 4        2 2017-12-08              1  RAK-SU FT WYCLEF/NAUGHTY BOY
## 5        9 2017-12-08              6     SELENA GOMEZ & MARSHMELLO
## 6        1 2004-09-12             28      DJ SAMMY AND YANOU FT DO
## 7       75 2011-10-30              1      SOLDIERS WITH ROBIN GIBB
## 8        2 2017-01-27             33 KUNGS VS COOKIN' ON 3 BURNERS
## 9       30 1999-01-17              4               SLADE VS. FLUSH
##                                track         label artist_num chart_pos
## 1                    THE LOVE I LOST PWL SANCTUARY      41240         8
## 2                       NEW HORIZONS         AZULI       9653       100
## 3 WALK... (THE DOG) LIKE AN EGYPTIAN         LOGIC       7134        75
## 4                             DIMELO    SYCO MUSIC      52716         2
## 5                             WOLVES    INTERSCOPE      52496        12
## 6                             HEAVEN      DATA/MOS       3502        98
## 7    I'VE GOTTA GET A MESSAGE TO YOU        DMG TV      25894        75
## 8                          THIS GIRL        3 BEAT      49557        96
## 9     MERRY XMAS EVERYBODY '98 REMIX       POLYDOR       5538        97
##   last_week
## 1         4
## 2
## 3        48
## 4
## 5         9
## 6       100
## 7
## 8        90
## 9
Okay, we’ve identified various terms that denote collaborations of some form. Not too bad. We just need to count the number of instances where the artist name includes one of these terms. Right? Maybe not.
##   peak_pos chart_week weeks_on_chart                     artist
## 1       85 2014-10-12              1                      AC/DC
## 2       56 2005-12-11              1   BOB MARLEY & THE WAILERS
## 3        5 1992-09-27              3 BOB MARLEY AND THE WAILERS
##              track     label artist_num chart_pos last_week
## 1        PLAY BALL  COLUMBIA      16970        85
## 2 STAND UP JAMROCK TUFF GONG      31532        56
## 3   IRON LION ZION TUFF GONG      31532         5         6
I’m a firm believer that domain expertise is a fundamental component of data science, so good data scientists must always be mindful of AC/DC and Bob Marley. Obviously, these songs shouldn’t be considered collaborations, so we need to exclude them from the analysis. Rather than manually evaluating each case, we’ll discount artists that include ‘&’, ‘AND’, ‘WITH’, ‘VS’ that registered more than one song on the chart (‘FT’ and ‘FEATURING’ are pretty reliable- please let me know if I’m overlooking some brilliant 1980s post-punk new wave synth-pop group called ‘THE FT FEATURING FT’). Obviously, we’ll still have some one hit wonders mistaken as collaborations. For example, Derek and the Dominoes had only one hit single (Layla); though we’re actually lucky in this instance, as the song was rereleased in 1982 under a slight different name.
##   peak_pos chart_week weeks_on_chart                 artist        track
## 1       68 1982-02-28              1 DEREK AND THE DOMINOES LAYLA {1982}
## 2       25 1972-08-06              1 DEREK AND THE DOMINOES        LAYLA
##     label artist_num chart_pos last_week
## 1     RSO      14664        68
## 2 POLYDOR      14664        25
# append column denoting whether that artist only ever had one charted song
uk_chart <- inner_join(uk_chart,
           uk_chart %>% group_by(artist) %>%
             summarize(one_hit=n_distinct(track)==1), by=c("artist"))
head(uk_chart, 5)
##   peak_pos chart_week weeks_on_chart                       artist
## 1        1 2017-12-08             30                   ED SHEERAN
## 2        2 2017-12-08              1 RAK-SU FT WYCLEF/NAUGHTY BOY
## 3        2 2017-12-08              7                     RITA ORA
## 4        1 2017-12-08             18 CAMILA CABELLO FT YOUNG THUG
## 5        2 2017-12-08             83                 MARIAH CAREY
##                             track           label artist_num chart_pos
## 1                         PERFECT          ASYLUM       6692         1
## 2                          DIMELO      SYCO MUSIC      52716         2
## 3                        ANYWHERE        ATLANTIC       7418         3
## 4                          HAVANA EPIC/SYCO MUSIC      51993         4
## 5 ALL I WANT FOR CHRISTMAS IS YOU        COLUMBIA      25943         5
##   last_week one_hit
## 1         3   FALSE
## 2              TRUE
## 3         2   FALSE
## 4         1    TRUE
## 5        22   FALSE
We’ve appended a column denoting whether that song represents that artist’s only ever entry in the charts. We can use a few more tricks to weed out mislabelled collaborations. We’ll ignore entries where the artist name contains ‘AND THE’ or ‘& THE’. Again, it’s not perfect, but it should get us most of the way (data science in a nutshell). For example, ‘Ariana Grande & The Weeknd’ would be overlooked, so I’ll crudely include a clause to allow The Weeknd related collaborations. With those caveats, let’s plot the historical frequency of these various collaboration terms.
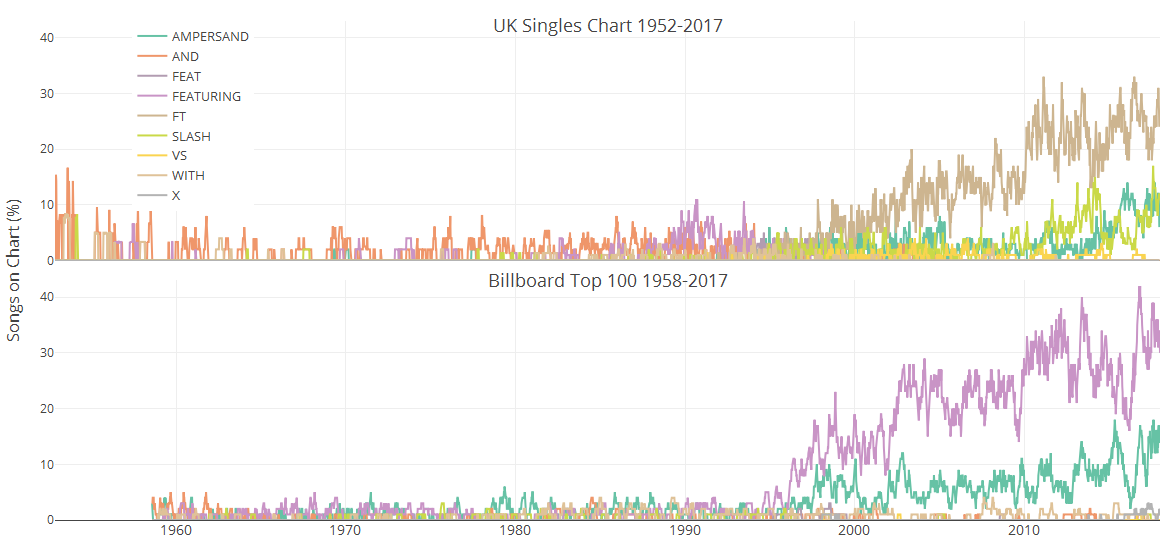
In the 1960s, 70s and 80s, colloborations were relatively rare (~5% of charted singles) and generally took the form of duets. Things changed in the mid 90s, when the number of colloborations increases significantly, with duets dying off and featured artists taking over. I blame rap music. Comparing the two charts, the UK and US prefer ‘ft’ and ‘featuring’, repsectively (two nations divided by a common language). The Billboard chart doesn’t seem to like the ‘/’ notation, while the UK is generally much more eclectic.
Finally, we can plot the proportion of songs that were collobarations (satisfied any of these conditions).
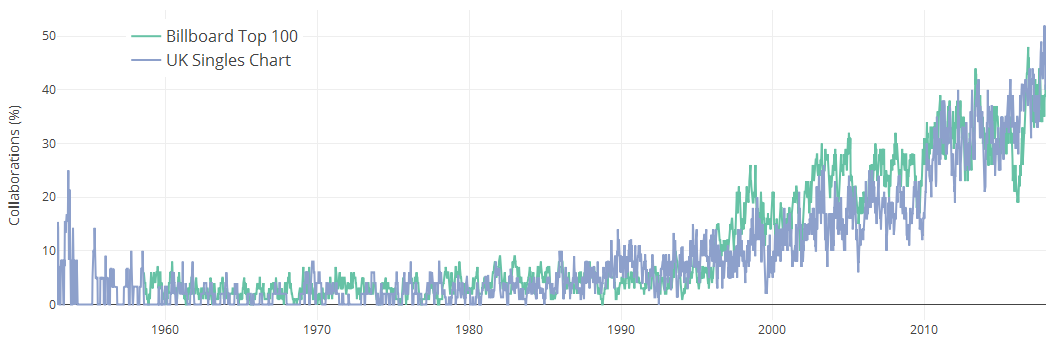
Clearly, collaborations are on the rise in both the US and UK, with nearly half of all charted songs now constituting collaborations of some form. I should say the Billboard chart has always consisted of 100 songs (hence the name), while the UK chart originally had 12 songs (gradually increasing to 50 in 1960 and 75 in 1978, finally settling on 100 in 1994). That may explain why the UK records high percentages in 1950s, as it would only require several colloborations.
Broadly speaking, the number of collaborations is pretty similar across the two countries. I suppose this isn’t surprising, as famous artists are commonly popular in both countries. Between 1995 and 2005, the proportion of collaborations runs slightly higher on the Billboard chart. Without any rigorous analysis to validate my speculations, I put this down to rap music. This genre tends to have more featured artists and I suspect it took longer for it to achieve mainstream popularity in the UK. Nevertheless, there’s no denying that collaborations are well on their way to chart domination.
Summary
Using Rvest, we pulled historical data for both the UK Singles Chart and the Billboard Hot 100. Putting it into a dataframe, we manipulated the artist names to distinguish collaborations and highlight of popularity of various collaboration types. Finally, we’ve illustrated the recent surge in song collaborations, which now account for nearly half of all songs on the chart.
So, that’s it. I apologise for the speculations and lack of cool machine learning. In my next post, I’ll return to artificial intelligence to predict future duets between current and now deceased artists (e.g. ‘Bob Marley & The Weeknd’). While you wait a very long time for that, you can download the historical UK chart and Billboard Top 100 files here or play around with the full R code here. Thanks for reading!
Leave a Comment